Attaching to a Remote Running RTSS Process
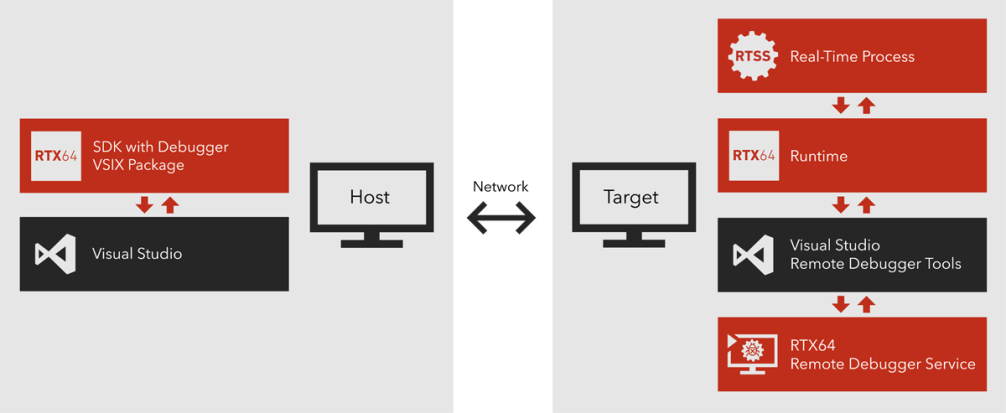
You can attach the Visual Studio debugger to an RTSS process running on a remote system outside of the Visual Studio IDE. This requires communication between the host system, which runs the Visual Studio IDE, and the target system where the process resides.
This topic provides instructions for configuring the Host-Target connection. For information on attaching to an RTSS process on a local system, see Attaching to a Local Running RTSS Process.
NOTE: You cannot use Task Manager or RtssKill to terminate a RTSS process that is being debugged.
NOTE: You cannot stop the Subsystem on the target system while RTSS processes are being debugged.
Sections in this topic:
- Setting up the Target System
- Attaching to a Process Running on the Target System
- Firewall Configuration
- Troubleshooting
Setting up the Target System
On the target system, install and configure the Visual Studio remote tools so the host system can connect over the network using Visual Studio. Then, configure remote debugging through the RTX64 Control Panel. You must also make sure the RTX64 Subsystem is running.
Step 1: INSTALL THE Visual Studio REMOTE tools
You must install the version of the Visual Studio remote tools on the target machine that is compatible with the version of Visual Studio installed on the host machine. View the Microsoft documentation to access the proper remote tools for your copy of Visual Studio:
- View the Microsoft documentation to determine the version of Visual Studio remote tools that you need:
https://docs.microsoft.com/en-us/visualstudio/debugger/remote-debugging
- Download and install the remote tools on the target system.
Step 2: CONFIGURE REMOTE DEBUGGING
Configure the remote debugging setup through the Configure Remote Debugging page in the RTX64 Control Panel.
Step 3: Start the Subsystem
Start the RTX64 Subsystem through the Control Panel, if it is not already running.
Attaching to a Process Running on the Target System
On the Target System:
-
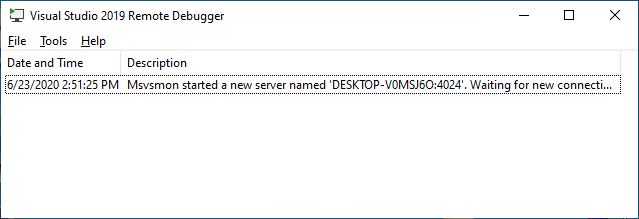
Launch the Visual Studio Remote Debugger from Start > All Programs > Visual Studio 2022/2019/2017/2015.
-
Optionally, change the default TCP/IP port by clicking Tools > Options.
-
Launch the RTX64 Control Panel
-
Under Remote Debug, click Change to open the Configure remote debugging window.
-
Click Allow remote debugging connections on this computer.
-
Verify the IP address of the target physical network appears as <IP address:port msvsmon>.
Optionally, change to the default port 31094.
NOTE: The msvsmon port and the RTSS remote debugging port must be different.
-
Restart the RTX64 Control Panel.
On the Host System:
Launch the version of Visual Studio that is compatible with the Visual Studio Remote Debugger on the target system.
- Under Debug, select Attach to RTSS Process.
The Attach to RTSS Process dialog appears. This dialog displays the name and process ID for each running RTSS process. You can hover the mouse over the process name to display its path in a ToolTip. All processes to which you are currently attached, or that are currently being debugged, are grayed out.
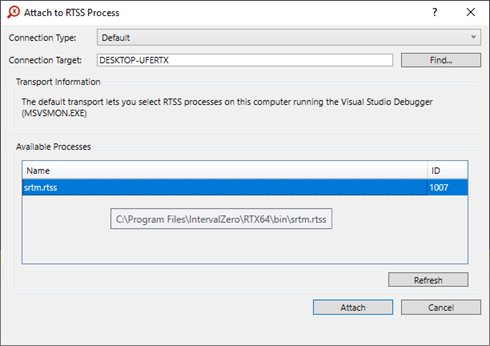
- For Connection Target, specify the remote computer using one of the following methods:
- Enter the name of the remote computer in the text box and press Enter.
- Enter the IP address of the remote computer in the text box and press Enter.
- Click Find. This opens the Remote Connections dialog, which lists all the devices that are either on your local subnet or directly attached to your computer.
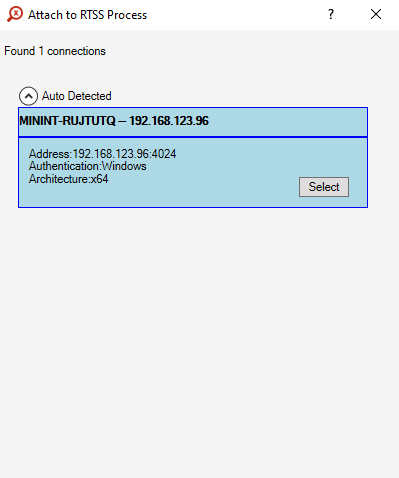
Select the computer or device you want to attach to, and then click Select. Use the Filter search box to search auto-detected connections by name or IP address.
NOTE: You may need to open UDP port 3702 on the target system to discover remote devices.
NOTE: If you can’t connect to the remote computer name, you may need to open port 31094 for the RTX64 Remote debugger and Visual Studio Remote Debugger ports. Follow the instructions available from Microsoft to determine which ports you need to open:
https://docs.microsoft.com/en-us/visualstudio/debugger/remote-debugger-port-assignments?view=vs-2019
- In the Attach to RTSS Process dialog under Available Processes, select the process you want to attach to, and then click Attach.
NOTE: Debugging multiple processes in one instance of Visual Studio is not recommended.
NOTE: You cannot attach to a process that is either frozen by Watchdog timeout or already under debugger control. A process that is both frozen and under debugger control will appear as debugged. Processes in either scenario will appear grayed-out in the Attach to RTSS Process dialog. You can hover over a grayed-out process to view a tooltip with information on why the process cannot be attached.
You should now see the Host-Target connection in the Visual Studio Remote Debugger dialog on the target system.

Firewall Configuration
If a firewall is in use on the target system, you may need to configure it to allow certain ports for remote debugging. See the instructions from Microsoft here:
Use command line New-NetFirewallRule (powershell) or netsh advfirewall firewall or manually add firewall rules using Windows Defender Firewall with Advanced Security.
For remote debugging, the following ports must be open on the remote computer:
| Ports | Incoming/Outgoing | Protocol | Description |
|---|---|---|---|
| msvsmon | Incoming | TCP | For more information, see Visual Studio remote debugger port assignments. |
| RTSS remote debugging (31094) | Incoming/Outgoing | TCP | Required for RTX64 remote debugger discovery. |
| 3702 | Outgoing | UDP | (Optional) Required for remote debugger discovery. |
Allow and configure the remote debugger through Windows Firewall or another firewall application:
- Launch Windows Defender Firewall or another firewall application.
- Select Allow an app through Windows Firewall or another firewall application.
- If RTX64 Remote Debugger or Visual Studio Remote Debugger doesn't appear under Allowed apps and features, select Change settings, and then select Allow another app.
Troubleshooting
If you encounter issues connecting the host and target systems, try the following:
- Verify the RTX64 Subsystem is running on the target system.
- Verify Allow remote debugging connections is enabled in the RTX64 Control Panel and that it's listening on the correct IP address on the target system.
- Verify Visual Studio Remote Debugging Monitor (MSVSMON) is running on the target system.
- Make sure the target system name or the IP address in the RTX64 Host-Target Connection window matches the Computer Name found in the Configuration Properties > Debugging dialog on the host system.
- Verify the application you selected from Attach to RTSS Process dialog on the host system is running on the target system.
- Antivirus programs may cause problems with remote debugging. If you are unable to create a successful remote debugging session, check to see if an Antivirus program is installed and active on the target system.
Related topics:
